Interactivity + Analytics = The Insight You’ve Been Missing
Hello Community! We are pleased to finally announce the release of Intuiface Charts & Dashboards, finalizing our effort to create the most complete analytics solution in the digital signage marketplace.
Why charts and dashboards? For some time, Intuiface has enabled you to track user interactions and collect contextual information (like weather, gender and more) to give those interactions context. What was missing was a means for analyzing the rich set of collected data. Intuiface users were asked to adopt often complex third party analytics tools, limiting the advantages of analytics to the few who already had extensive experience.
Intuiface Charts & Dashboards changes all of that, enabling you to turn data into insight. It’s the power of the most advanced analysis tools on the marketplace in a surprisingly simple Web-based drag-and-drag tool set.
Why Intuiface Analytics? Because by tracking design, operational, and business objectives, you can maximize project success. To manage you must measure and Intuiface is uniquely capable of making this possible.
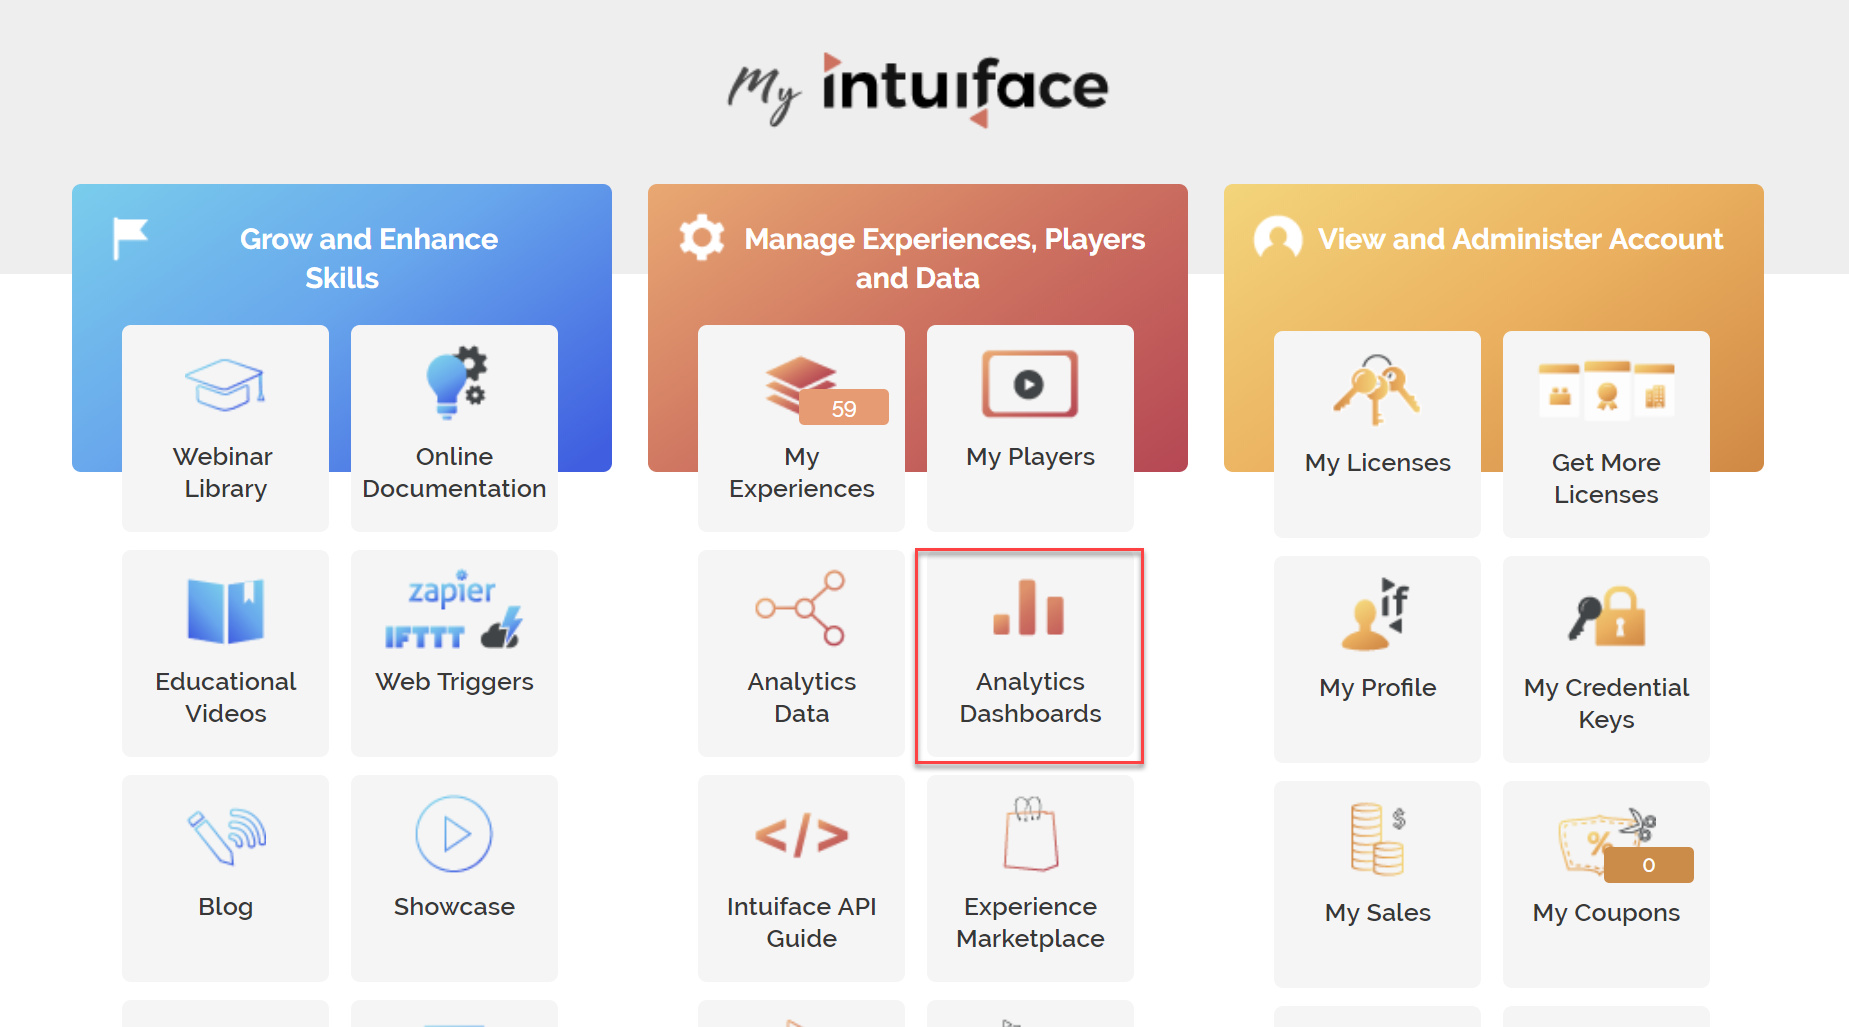
Read the full announcement post and find out what’s new and everything you need to know about the new Intuiface Analytics!!