I am looking for a way to dynamically generate diagrams, like a pie chart, using values of users’ answers. According to an older post, (https://support.intuiface.com/hc/en-us/articles/360007179352-Circular-Panel) a circular panel collection could be used, but this asset is deprecated. Could I code something like this, using HTML frame or through creating a custom intuiface asset? Thank you!
Hi @bruno.arnold,
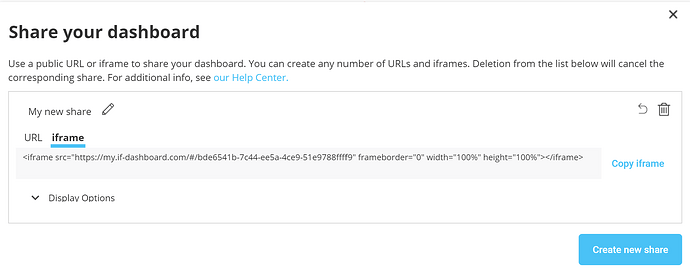
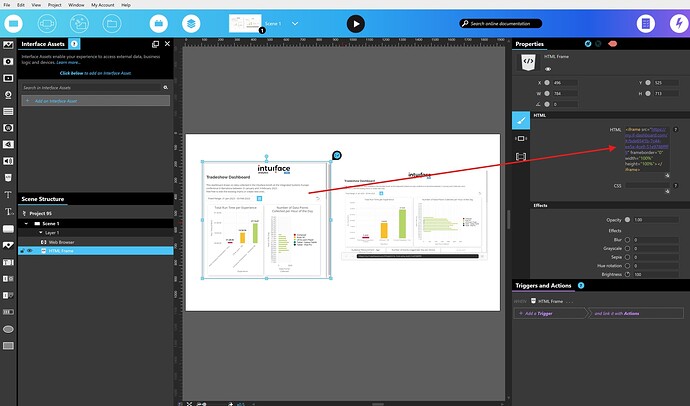
One solution would be to use Analytics to log the users answers, create your own Analytics Dashboard, share the dashboard, and then embed the iFrame code in a HTML Frame asset or use the URL in a Web Browser asset to display the Analytics Dashboard within your experience.
Please see the screenshot below, of an Analytics Dashboard embedded within an experience
I hope this answers your question,
Kind Regards
Louie
2 Likes
Another option would be to use Google Charts inside an HTML frame. Here is more information on doing this.
This option will show the results “instantly”, but if you want to keep the data between sessions you will need to save the values to an Excel sheet or Airtable.
-Ryan
2 Likes


