No other analytics tools for interactive applications in the market can allow you to so conveniently and strategically define, collect, visualize, and share the performance data the way Intuiface Analytics does. We are pretty proud of it. But that is not to say Intuiface Analytics is perfect. If we were to believe anything we achieve is perfect, we’d have no more work to do.
So here’s another example of how we give up on being perfect for making a continuous improvement - NEW FEATURES FOR INTUIFACE ANALYTICS! - We are excited to announce Chart Options.
Here’s how it works
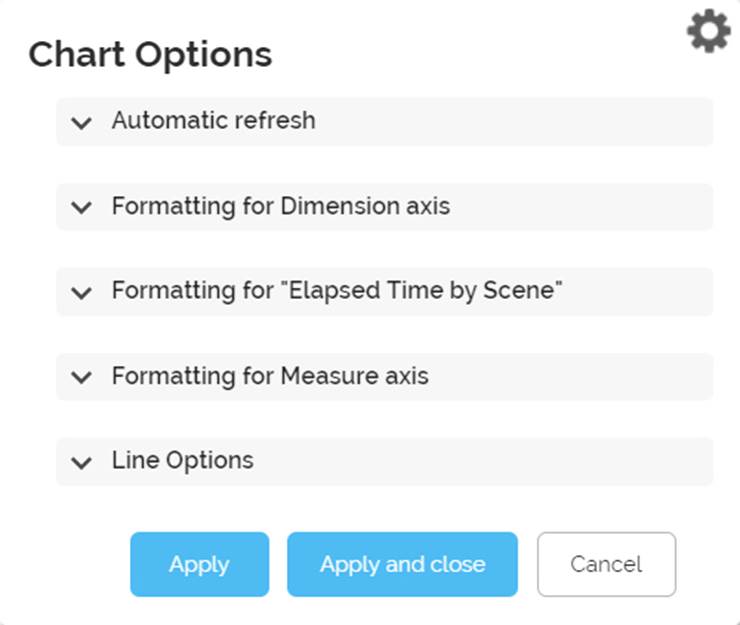
Use the Chart Options panel (![]() ) to control how values should be formatted, how often the chart should update, and how lines (if used) should be drawn. Click the “Apply” button to preview your changes; click the “Apply and close” button to apply the changes and close the Chart Options panel.
) to control how values should be formatted, how often the chart should update, and how lines (if used) should be drawn. Click the “Apply” button to preview your changes; click the “Apply and close” button to apply the changes and close the Chart Options panel.
· Automatic Refresh
- Specify how often this particular chart will refresh its data feed.
- Duration options are never, every 15 / 30 minutes, and every 1 / 4 / 12 / 24 hours
- Every time a dashboard is loaded/reloaded, all charts will be refreshed as well, regardless of the Automatic Refresh setting here
· Formatting for Dimension axis
-
Sort : Appears if the values on the Dimension axis do not represent timestamps.
Specify whether values on the Dimension axis should be ordered numerically/alphabetically or if the order should reflect the value of corresponding data points on the Measure axis. - Date Format : Appears if the values on the Dimension axis represent timestamps. Use this section to format how the elapsed time is visually represented.
- Reverse X-axis : Flip the Dimension axis by 180 degrees. Only applies to two-dimensional charts.
- Reverse Y-axis : Flip the Measure axis by 180 degrees. Only applies to two-dimensional charts.
· Formatting for [each parameter on the Measure axis]
- Every parameter represented on the Measure axis is given a dedicated section for formatting the visual representation of each data point within the chart, the tooltip, and the data table.
· Formatting for Measure axis
- Use this section to specify how Measure values should be visually represented along the Measure axis itself.
- If represented by numbers:
- Number Format : Contains a set of presets for the remaining fields. Choose the “Custom” option to create your own format.
- Round to : Sets the number of decimal places. Numbers are rounded up.
- Multiplier : Multiples the single value but the number specified here. For example, use the value 100 to turn a decimal into a percentage.
- Prefix : Add text before the single value
- Suffix : Add text after the single value
- If represented by elapsed time
- Number Format : Don’t change this value. Leave it set to “Time”.
- Input Value Unit : Specify how the elapsed time was measured. Intuiface defaults to measurement in seconds.
- Display Hours / Display Minutes / Display Seconds : Identify how to visually represent elapsed time.
- Separator : Specify how values for hours/minutes/seconds should be visually separated.
· Line Options
-
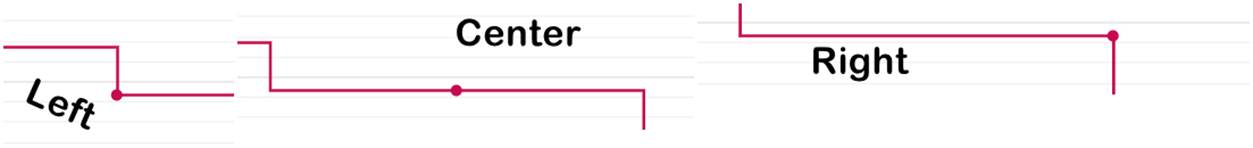
Step Line : Appears if the selected Chart Type uses lines. Specify whether a stepped line should be used instead of a straight line to connect data points and - if a step line is used - specify whether each data point should be on the beginning (left) of its step, the end (right) of its step, or centered (center) on its step.
- Marker Type : Appears if the selected Chart Type displays individual data points. Specify the kind of icon that should be used to represent each data point. Not all charts display each individual data point (e.g. Pie Chart).
- Line Type : Appears if the selected Chart Type uses lines. Specify how the line should be drawn. Not all charts use lines (e.g. Pie Chart).
- X Zoom : Appears if the selected Chart Type displays individual data points. Toggle whether or not the click-drag of a mouse over specific data points in the chart will zoom the chart onto those selected data points.