-Click image to see the real dashboard -
Smart digital signage isn’t only about what people see. There is also a backstage advantage. They track and collect data generated by user behavior on a systematic basis. Then, with the help of a robust analytics platform, you can define, collate, filter, and visualize this data to gain important design, operational, and business insights - insights you can use to improve signage effectiveness. One can’t overstate the importance of analytics in the delivery of a successful digital signage project.
Sounds great, right? But here’s something that’s often overlooked: the readability of your data.
Just throwing together a bunch of line, bar, and pie charts won’t mean anything if they’re not telling a clear story or leading you to clear conclusions. Your charts should be immediately meaningful, not just for you but for stakeholders who may not be eating and sleeping your analytics efforts.
That’s where the recently released Single Value Chart comes in handy.
Single Value Charts are the classic approach to presenting Key Performance Indicators (KPIs): display the latest value for a target measurement and optionally compare it to the previous period’s value to visualize progress. Paired with many formatting and customization options, the Single Value Chart may very well become the most common chart type used in your dashboards.
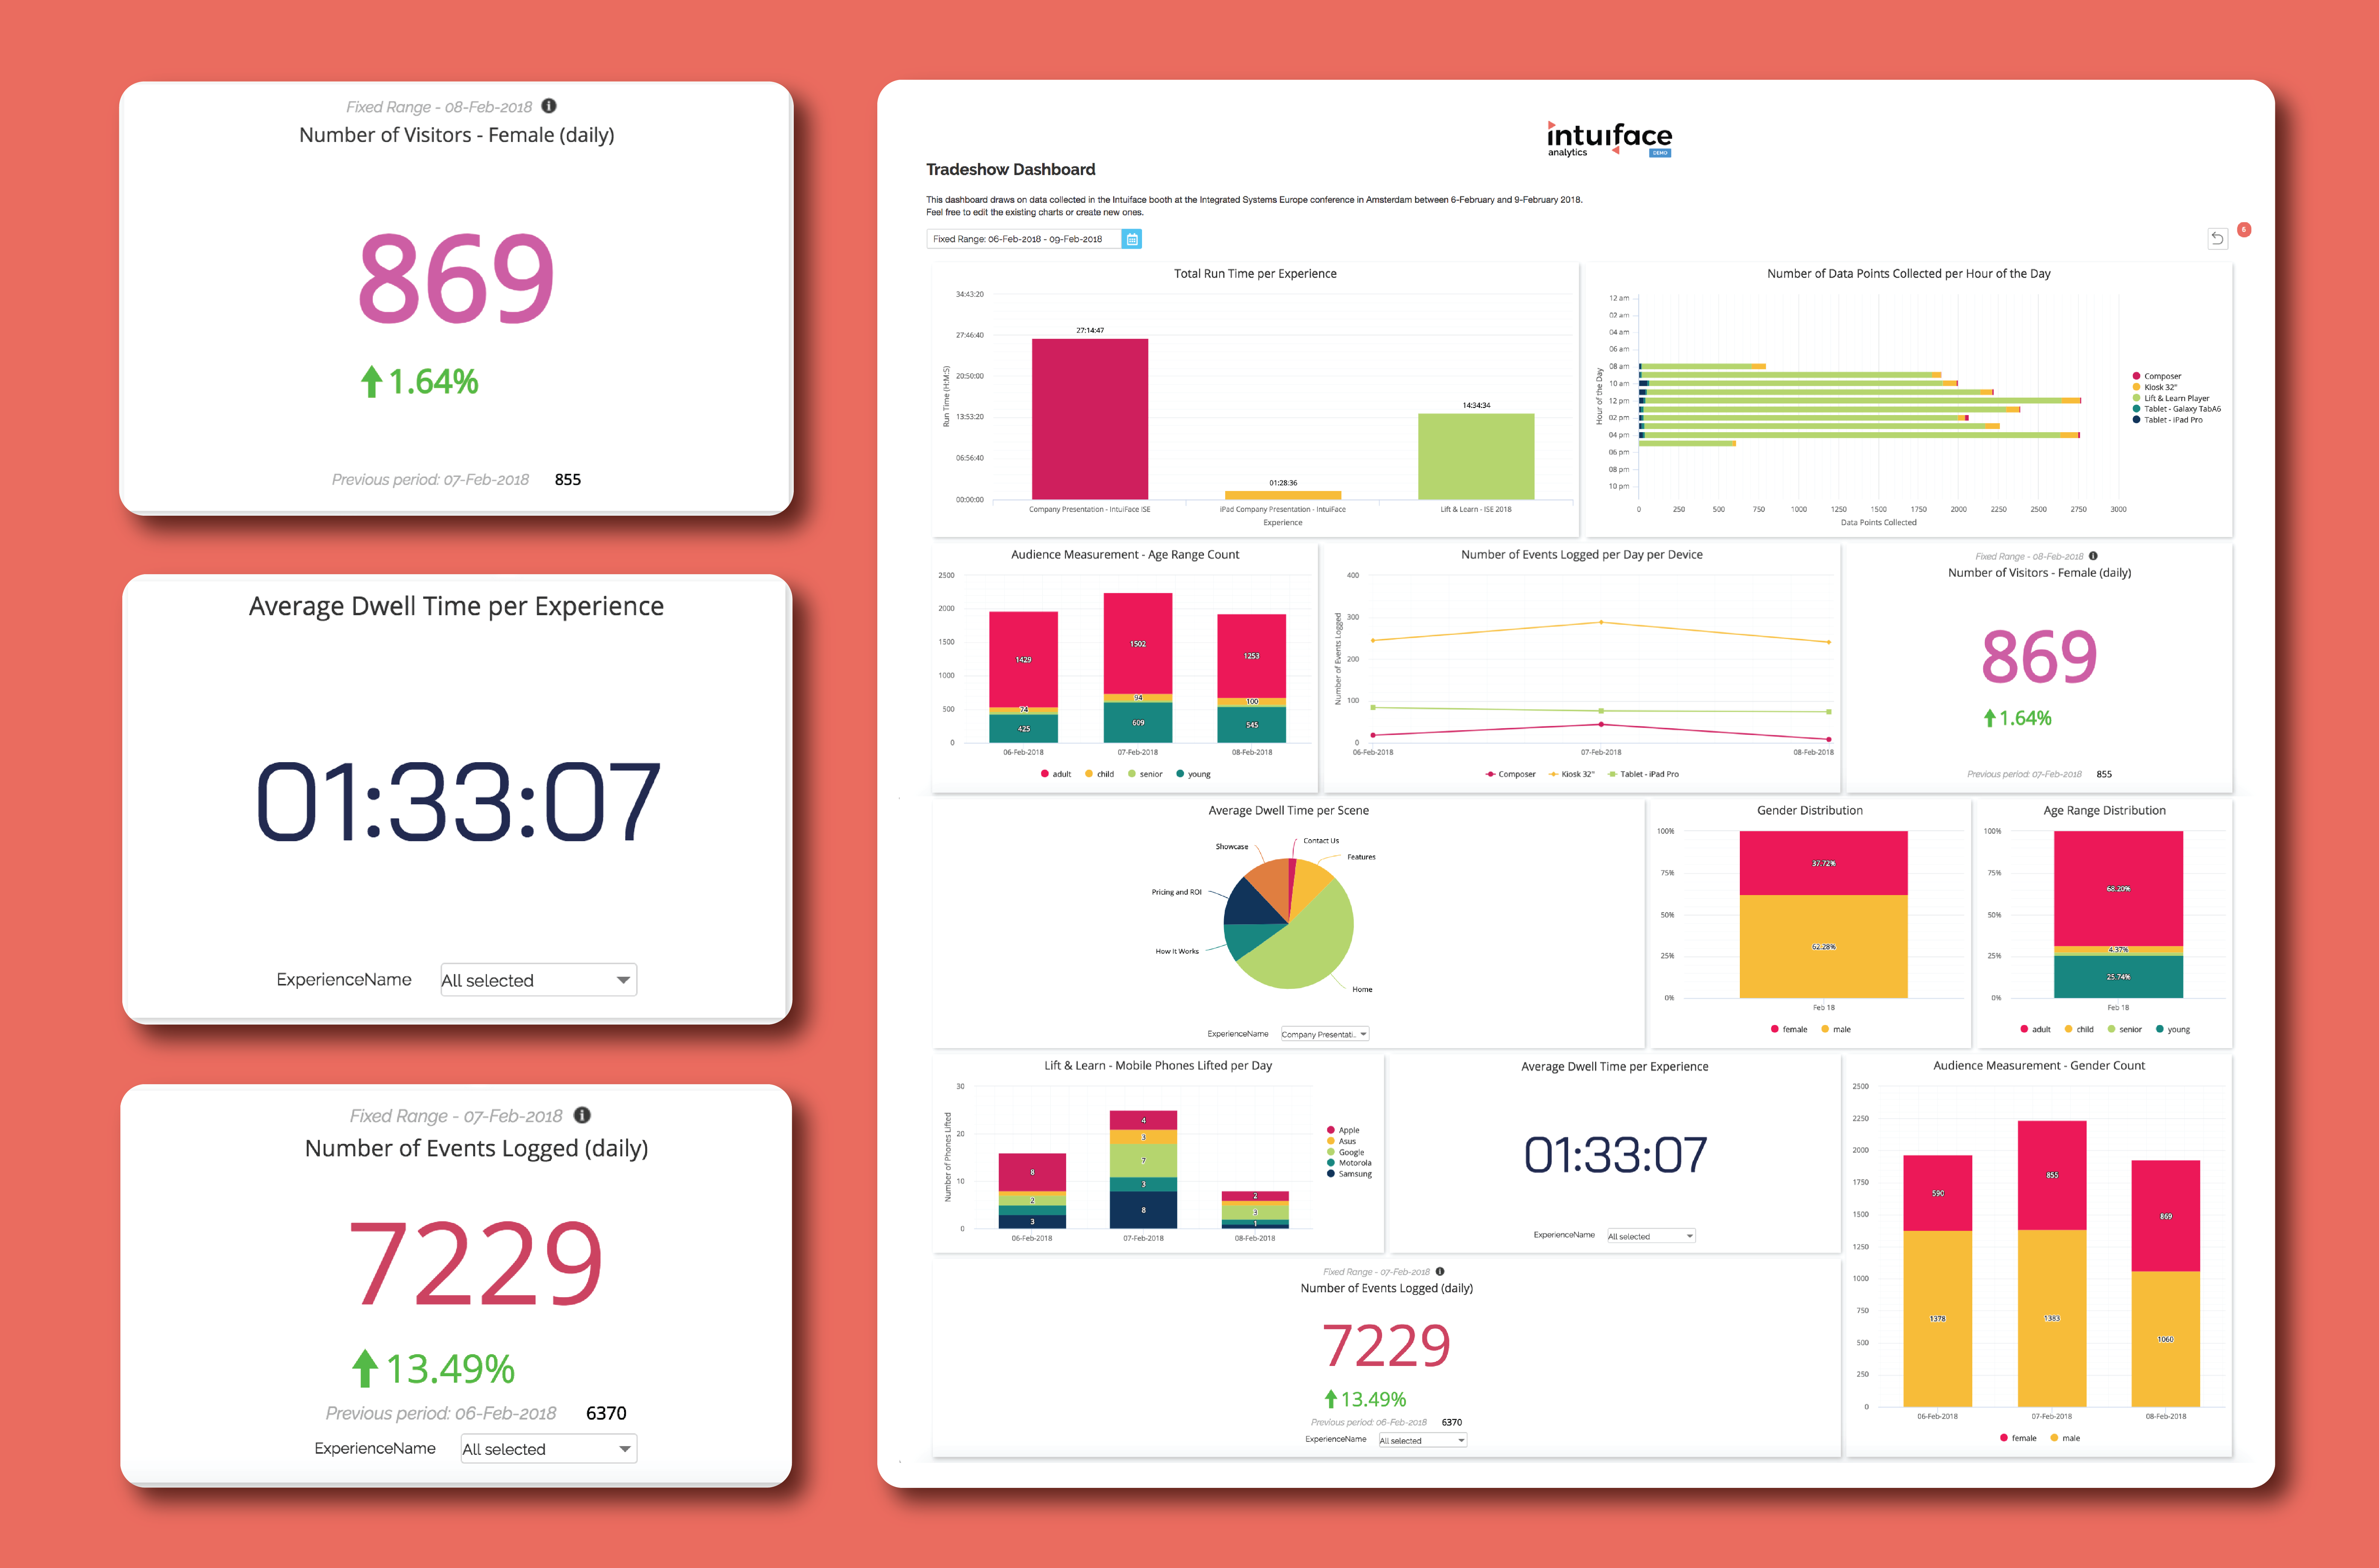
Seeing is believing! We prepared a dashboard with charts visualizing real data collected in our booth at ISE 2018 in Amsterdam. Click to see the dashboard
Why this data set? During ISE 2018, we ran four different experiences, each of which generated data providing us with business-level insight (e.g., dwell time, # of visitors, gender distribution, etc.), the kind of insight we thought would resonate with any Intuiface end-users evaluating how Intuiface Analytics could work for them
.
In it, you can find three Single Value Charts:
- Average Dwell Time Per Experience
- Number of Visitors - Female (daily)
- Number of Events Logged (daily)
How are you and your business gauging the performance of your digital signage software?
Want to try it out? Check out our dashboard and create your own!