Hello, Community
As you may have noticed with our most recent preview video for the upcoming Charts & Dashboards feature - here’s the video in case you missed it - we are working hard on the final polish in preparation for proudly releasing Intuiface Analytics. ![]()
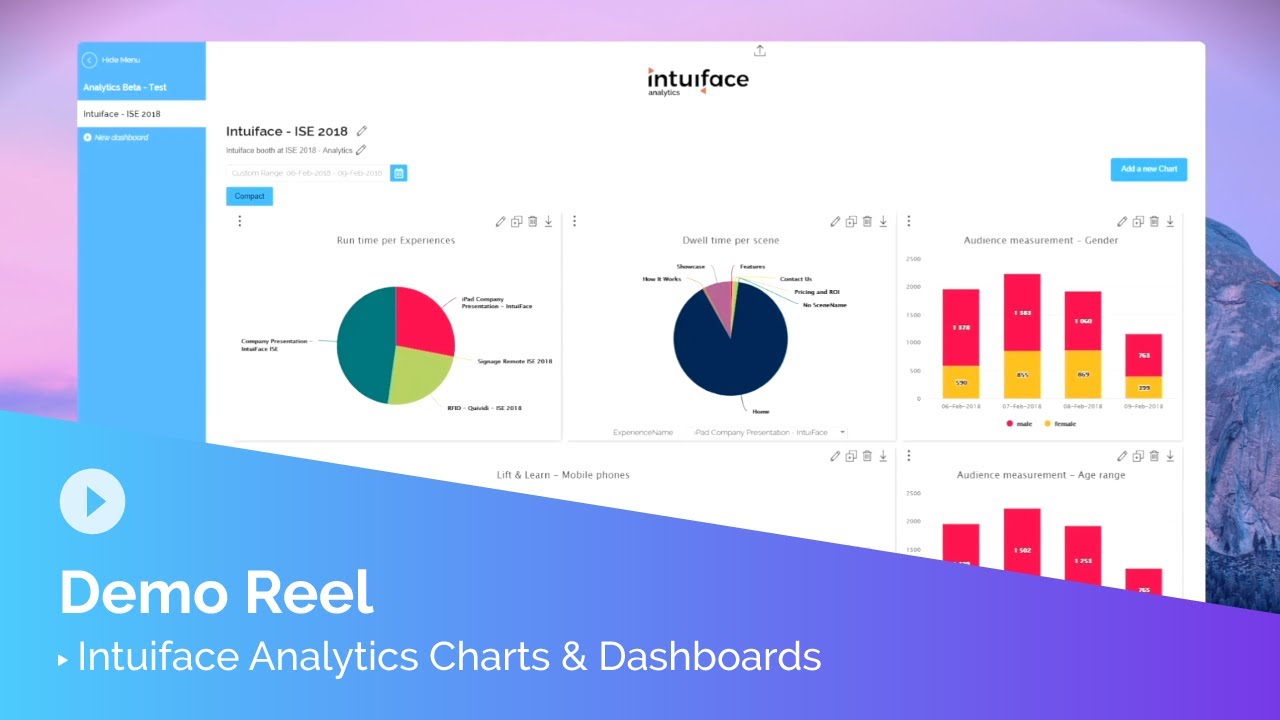
We’re bursting with excitement so we couldn’t help ourselves and have made a third video. This time, we’re using real data to build a dashboard with real insight. Think of it as a day-in-the-life.
Fan favorite Seb Meunier created this video but hopefully it’ll be clear that what you watched wasn’t hard. Seb built 5 charts in under 5 minutes, resulting in a dashboard filled with actionable information.
Analytics is core to successful, meaningful digital content deployment. With Intuiface, you’ll have state-of-the-art capability.
